Physical Address
304 North Cardinal St.
Dorchester Center, MA 02124
Physical Address
304 North Cardinal St.
Dorchester Center, MA 02124


For a long time, I was convinced that work consumes an overwhelming portion of our lives.
Then I actually did the math—and the result surprised me.
In this article, I explore why work feels so dominant, what the numbers really say, and whether accepting a bad work environment for higher pay can ever be a rational decision.
There is no universal answer. The right choice depends on personality, values, and life context. Any claim to the contrary would be misleading.
My goal here is to present the facts clearly, and let you decide for yourself.
People are motivated by very different things.
For me, financial security has been a lifelong concern—mainly influenced by growing up very poor (or so I’ve been told). That fear pushed me into several questionable choices:
At the time, these decisions felt rational and responsible. Looking back, they didn’t even deliver the financial outcome I was aiming for: after 19 years of work, I still can’t retire.
I did learn something from each experience, and I made lasting friends along the way, so I don’t fully regret those choices.
Still, now that I’ve experienced a healthy work environment, I can’t help wondering how different things might have been with better decisions earlier on.
If there’s one reason I’m sharing this, it’s not to focus on past mistakes, but to learn from them—and encourage you to look honestly at your own motivations.
This question became unavoidable for me when, while I was working for a boss who made my work life miserable, I received an offer from what looked like a genuinely healthy workplace—but with a salary about 20% lower.
I turned it down.
At the time, I justified the decision as rational, pointing to:
Looking back, the decision was also influenced by inertia—and, if I’m being honest, a bit of greed.
I avoided doing the full calculation for years.
Until now.
This might look like a typical “New Year reflection,” but it isn’t.
I’ve wanted for a long time to build a proper time & savings calculator and write a structured article on this topic. What I was missing wasn’t motivation, but uninterrupted time—to think clearly and to code.
In the meantime, I also dug into several economic models on how people actually spend and save money, and debated more than a few investment ideas with acquaintances.
Spoiler: most investment offers benefit the seller, not you.
So let’s get into the facts.
I broke life down into these large buckets:
Because everyone’s situation is different, I built a calculator so you can run the numbers for yourself (links at the end of the article).
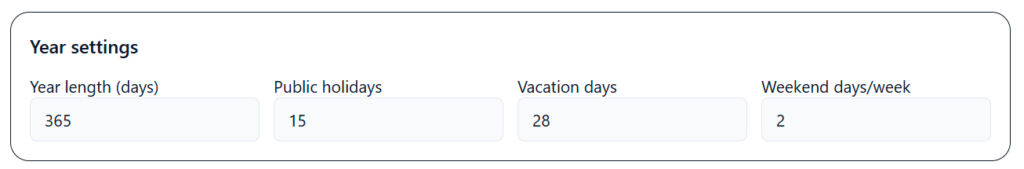
Below are my numbers at the time.
My employer at the time offered 28 vacation days per year, plus all public holidays.
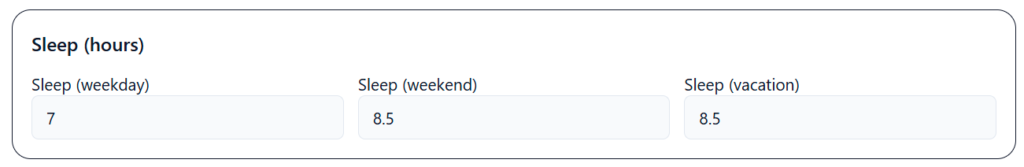
On an average workday, I spent about 7 hours on sleep-related activities—including preparation for sleep, trying to fall asleep, and actual sleep. I compensated slightly during weekends and vacations.
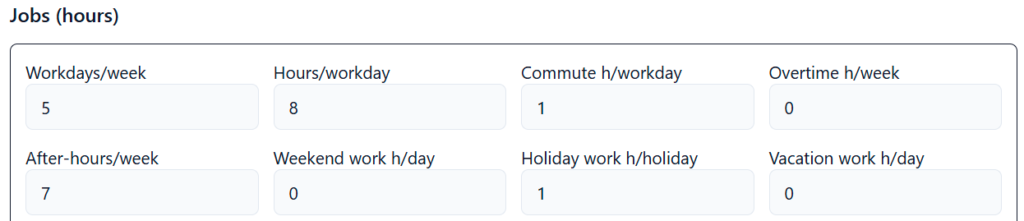
I worked a lot. Sometimes I was officially on-call, but more often I exceeded my normal schedule without being paid for it. The main reason was that my workdays were chaotic. If I wanted uninterrupted thinking time and focused work—to do my job well—I needed additional quiet hours.
On average, that meant:
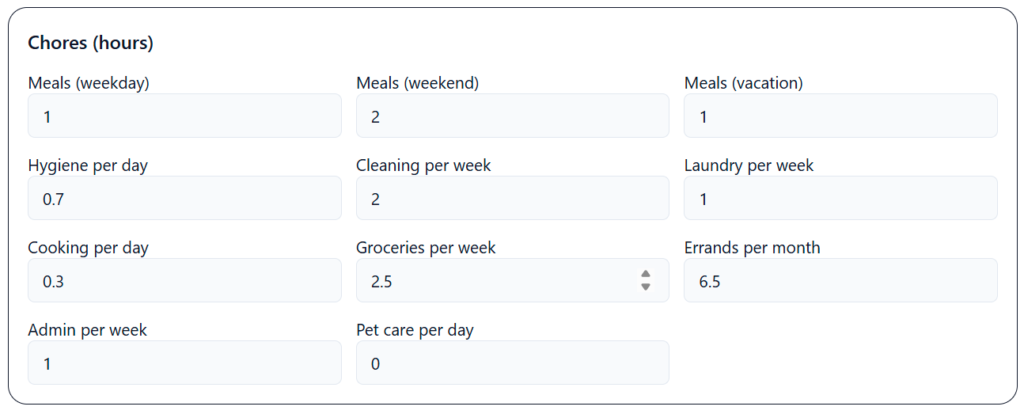
Not having kids simplified my daily schedule:
The result: after adding everything up: 27% of my total time was actually free.
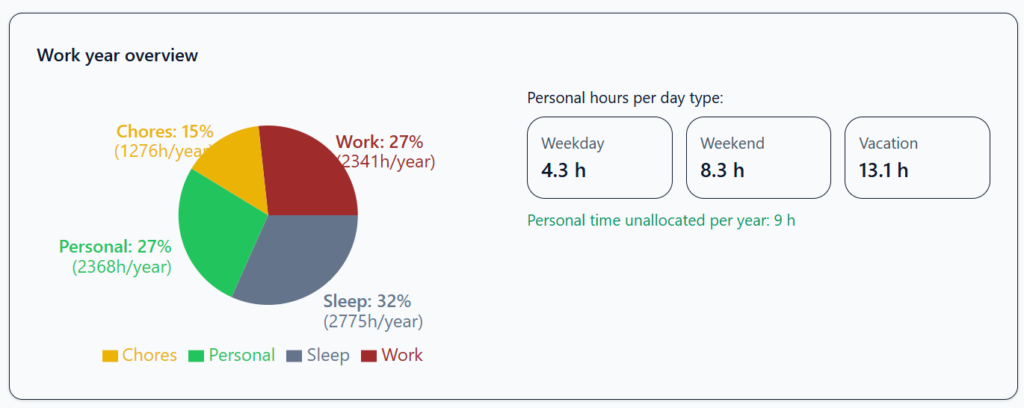
That free (personal) time was distributed roughly as:
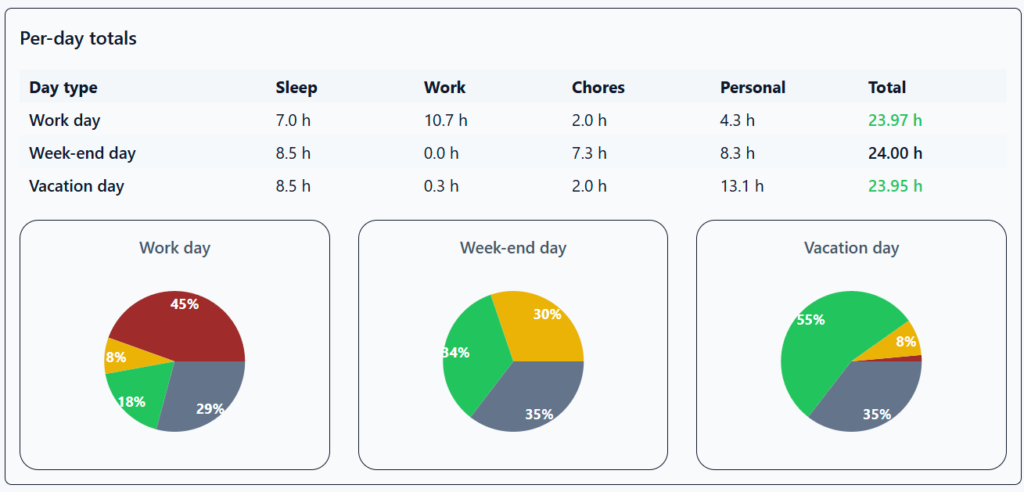
I felt like work was consuming my life—but objectively, the numbers showed something different: across the year, work and free time were split evenly (27% vs 27%). The amount of free time surprised me – was higher than I expected.
So where did the exhaustion come from?
Looking back, I think it came from two main factors:
That inability to disconnect wasn’t accidental. It was driven by a constant sense of ownership and responsibility, combined with insecurity: unclear expectations, blurred responsibility boundaries, and micromanagement. Even small issues could have outsized consequences—not because the systems themselves were fragile, but because accountability was unpredictable.
The result was persistent mental load—even off work—which also prevented me from using my free time well, despite technically having enough of it.
If you’re in a bad environment and still staying, one of two things is usually true:
You may feel the market is bad, that no one else would hire you, or that staying put is the safest option.
In most cases, the issue isn’t a lack of opportunities, but a lack of space to imagine them. Fear—especially fear of failure or of the unknown—can narrow our field of view.
I want to encourage you to genuinely explore the possibilities. Alternatives almost always exist, even though we can’t clearly see them yet.
If, after serious reflection on what you enjoy doing and what you believe in, you still struggle to identify any options, resources like 80,000 Hours can help expand that perspective by offering encouragement, training paths, and concrete examples of different directions.
In this case, the choice is real. You’re not stuck—you’re weighing trade-offs.
Those trade-offs is what we’ll explore next.
In practice, extra income usually goes in one of two directions:
1. Better goods and services — for yourself and/or your family
A better home, better furniture, cooler gadgets, higher-quality food, improved amenities or travel experiences, better education for children, and better health services.
2. Saving for financial independence
Retiring earlier by investing more—accepting a more difficult present in exchange for the possibility of a more comfortable future.
Let’s look at both, using facts and numbers.
Research shows that paying more can increase emotional satisfaction, but not always objective quality.
Several psychological mechanisms are at play:
My quest here, however, is to get past perception and focus on what extra money actually buys in objective terms. So I’ll stick to data and measurable quality.
Research consistently shows that quality does not scale proportionally with price. In fact, the opposite tends to happen: the more you pay, the smaller the marginal gain in satisfaction or objective improvement.
In practice, the curve looks roughly like this:
Low → mid-range
Moving from cheap to competent products usually produces large, objective improvements in quality. These gains often include:
In this range, price increases can yield disproportionate quality gains, because low-end products often fail to meet minimum reliability or safety thresholds.
In practical terms, a roughly 100% price increase can sometimes correspond to very large improvements in durability or reliability—often far exceeding what a linear model would suggest.
These figures are illustrative, not universal, but they reflect a common step-change observed when moving out of the lowest quality tier.
Mid-range → upper-mid range
Once basic competence is reached, further improvements tend to shift toward:
For most users, these gains activate infrequently. As a result, a substantial price increase (e.g. ~50%) often translates into very small day-to-day improvements in experienced or measurable quality.
For average usage, the marginal benefit is frequently close to negligible, even if specialized users may extract more value.
Upper-mid → premium
Beyond this point, prices continue to rise primarily due to:
Objective performance improvements tend to plateau, with remaining gains concentrated in consistency, finish, or tolerance rather than raw functionality. For most consumers, this is the point where additional spending mostly affects how a product feels or is perceived, rather than how well it performs in normal use.
To approach this rationally—not emotionally—I started with a “basic needs” budget. The goal was to identify the minimum amount of money I actually needed to live a decent life.
This budget already relies on a lesson learned the hard way: “I’m too poor to buy the cheapest things”. In other words, optimizing only for the lowest upfront cost often leads to higher long-term expenses.
Fortunately, I had logged most of my spendings over the past years, so this analysis is grounded in real data, not estimates.
For the sake of simplicity, I’ll continue the analysis using the least favorable scenario: just me.
So I needed only 4500 RON to live a decent life.
Anything missing?
Potentially housing credit or rent. Based on my own experience, I added 1,000 RON/month to shelter costs. When paying a mortgage, my average shelter expenses were around 25k RON/year.
Ah yes, vacations. I spent roughly 10k RON/year, including trips abroad.
Final numbers:
Going back to the initial question, the impact of a 20% pay cut depends heavily on the current salary level.
At this level, a 20% reduction would significantly reduce quality of life, directly affecting the ability to meet basic needs.
If I were in this situation, I wouldn’t switch jobs for a lower-paying offer—even if the environment looked better. Instead, I’d focus on a learning path toward a better-paid role. In practice, that still means changing jobs, just not immediately and not at the cost of financial safety.
Learning is hard, but time invested in learning usually pays off in salary growth. And if you compare the effort required to learn something new with the effort of enduring a bad boss day after day, the trade-off often becomes clearer.
For reference, the current average net salary in Bucharest is 6,749 RON, which generally excludes other benefits.
In this range, the trade-off is usually between:
For the rational me, that exchange isn’t worth it.
One thing worth mentioning here: according to Keynesian consumption theory, higher income tends to lead to higher consumption rather than proportional increases in saving. Insights from behavioral economics further suggest that much of this additional spending delivers limited objective improvements in well-being, unless it is intentionally directed with consistent discipline.
My own data strongly supports this.
At the time, I was spending around 10,000 RON per month, with most of the extra money going into areas that added little real value:
Spending increased. Objectively measured life quality barely did.
If the salary is higher than 10,000 RON, the discussion shifts.
At that point, additional income can realistically be directed toward saving and investing, with the goal of retiring earlier.
But this is a bet: choosing to live a more constrained life now in exchange for the possibility of more freedom later—without knowing when we’ll die, or how healthy we’ll be when we finally reach retirement.
And that leads us to the second major scenario.
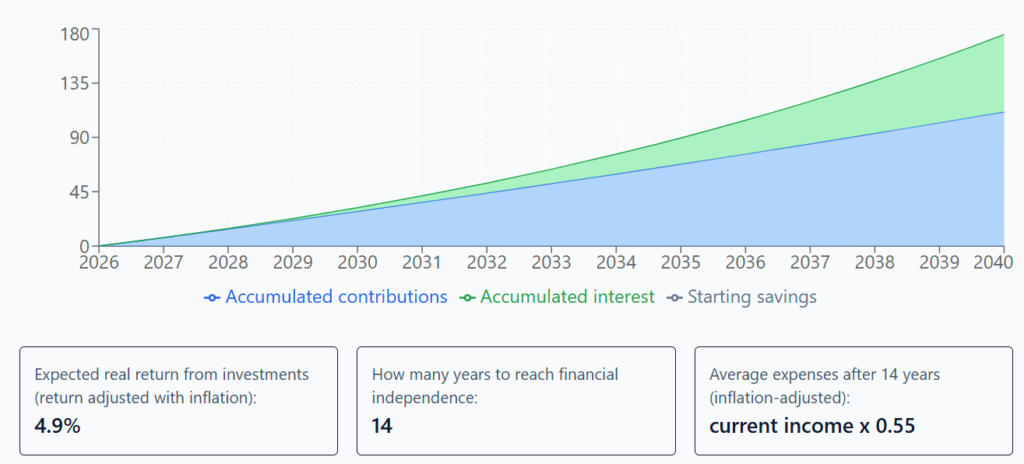
There are multiple economic models for saving, but I find the simplest to be FIRE (Financial Independence, Retire Early).
The model is straightforward, but demanding. To make its projections meaningful, it requires strong discipline:
In my case, the difference between the two job scenarios looked like this:
That second number assumes perfect discipline—which, in reality, I did not have
Framed this way, the question becomes simple for me.
Are:
worth
Here’s how this looked when projected across my life, considering I had already worked 19 years and using the average life expectancy for men in Romania.
| NICE ENV JOB | BAD ENV JOB |
| 19 + 17 years of work | 19 + 14 years of work |
| Life expectancy: 73 years | Life expectancy: 73 years (kept the same for comparison, although stress would likely lower it) |
 |  |
 |  |
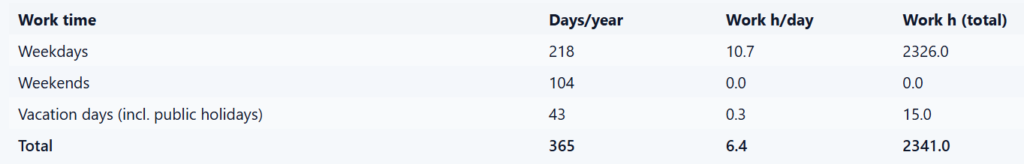
A subtle but important detail: one result looks counterintuitive: it appears that I would work more total hours over the remaining 14 years in the bad job than over the 17 years in the nicer one.
That’s slightly misleading. Here’s the reason: my calculator applies the entered yearly conditions uniformly across the entire lifespan, not just the remaining years. When you isolate only the remaining working years, the numbers are clearer:
| NICE JOB: 17y x 2,034h/year = 34,578h | BAD JOB: 14y x 2,341h/year = 32,774h |
Still, the total picture is worth considering, especially if you have more working years ahead of you than behind you.
My rational conclusion: at the scale of an entire life, that trade-off wasn’t worth it. I was indeed wrong to reject the offer and stay in the bad environment.
Your variables will, of course, be different from mine.
Run the numbers for your own situation—and if you feel like it, share the result. You might prove me wrong, or you might help someone else see new possibilities.
If you discover something surprising—or spot a bug—please let me know. A direct message is ideal, but comments work too. Your insights might encourage someone else to act, or help refine the ideas further.